
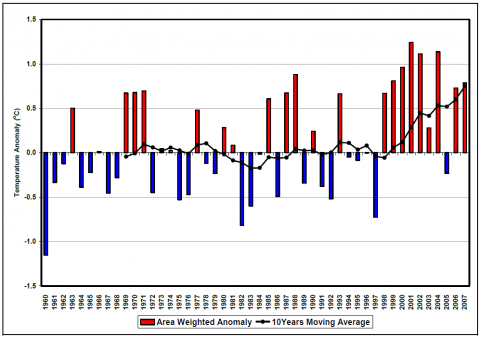
The figure displays the area-weighted annual mean maximum temperature anomaly of Pakistan calculated from the observed data of 40 stations across the country. The data period is from 1960 to 2007. Ten years moving average is plotted alongwith the anomaly.
The rise in maximum temperature can clearly be seen. The air has been warming at the rate of 0.18C per decade and the total change is 0.85C over the period mentioned above. This change is significant at 99% level. There is no significant change from start of the series upto 1997, but after that the warming increased very rapidly at the rate 0.36C per decade and so was the rise in maximum temperature in the last decade.
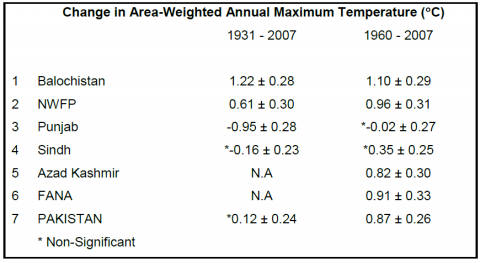
All the provinces of Pakistan display rise in mean maximum temperature for the period, aforementioned, which is significant at 99% level except Sindh and Punjab. The linear trend ranges from 0 – 0.23C per decade. The largest change occurred in NWFP and smallest in Punjab. It has been observed that increase in annual maximum temperature is higher in Balochistan, NWFP, Federally Administered Northern Areas (FANA) and Azad Kashmir. This increase is 1.10C, 0.96C, 0.91C and 0.82C, respectively, for the period mentioned in Fig. 3. There is statistically non-significant rise of 0.35C in maximum temperature in Sindh and slightly decreasing (almost zero) change in annual maximum temperature in Punjab during 1960 – 2007.
Area-weighted annual maximum temperature have been calculated for four stations, Bahawalpur, Faisalabad, Lahore and Sialkot, of the Punjab for which data is available since 1931 to analyze the long term change in maximum temperature of the province. The analysis revealed that there is decreasing trend on all four stations. The stations may be placed, in such an order that station with highest decrease at first and with lowest decrease at last, as Sialkot, Lahore, Faisalabad and Bahawalpur. A decreasing trend has been observed in the province for the period 1931 – 2007, which is significant at 99% level. Total decrease in this period is 0.9 C.
Maximum Temperature records since 1931 are also available for six stations of Sindh. On the basis data of these six stations, the maximum temperatures trend for Sindh is decreasing for the period 1931 – 2007. This trend is non-significant, as is for the period 1960 – 2007. Total decrease in this period is 0.16 C. It is observed that three stations have decreasing trends of maximum temperature. The largest decreasing trend is of Badin, then Jacobabad and then Hyderabad. Coastal station Karachi has increasing maximum temperature trends. Rohri and Chhore have slightly increasing non-significant trends for the period 1931 – 2007.
Trends of annual maximum temperatures of NWFP are increasing with significance at 99% level for the period 1931 – 2007. Total increase is 0.6 C in this period. This analysis is based on the data of four stations, Drosh, Peshawar, Parachinar and Dera Ismail Khan. The largest increase has been observed at Drosh, then Peshawar.
D. I. Khan has decreasing trend; while Parachinar also has decreasing trend but non-significant, for the period mentioned before.
Long-term mean maximum temperature series of Balsochistan revealed that there has been significant warming in the province at the rate 0.2C per decade. Total increase in the period is 1.2C. Data records of four stations; Dalbandine, Panjgur, Pasni and Sibbi are available with PMD. Increasing trends of maximum temperatures has been observed on all four stations. The stations may be placed, in such an order that station with highest increase at first and with lowest increase at last, as Dalbandine, Pasni (Coastal Station), Sibbi and Panjgur.
From the above discussion it is clear that some significant changes in area-weighted maximum temperatures have been observed. The analysis of both, long and short term datasets revealed a decreasing trend of maximum temperature in Punjab, increasing trends in NWFP and Balochistan. A non-significant increasing trend in Sindh from 1960 – 2007 and non-significant decreasing trend from 1931 – 2007. FANA and Azad Kashmir have significantly increasing trends of maximum temperatures.
Frequency of extreme maximum temperature events have also been calculated, For this purpose the eighteen stations have been used for which daily time series of Maximum Temperature was available since 1960. For these stations, TX90P i. e. Percentage of days in a year when Maximum Temperature was more than 90th percentile, have been calculated. It revealed that the frequency of warm days has been increased significantly in North Pakistan. Three stations of Balochistan have shown the increase of 4 – 16 days per decade. Hyderabad, Sindh in showing the decrease of 4 days in the frequency of warm days, while most of the stations of Punjab are showing non-significant change in the warm days.