
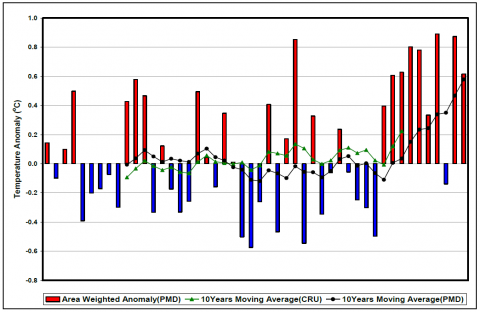
The figure depicts the area-weighted mean annual temperatures of Pakistan from 1960 – 2007, calculated from 38 synoptic stations of PMD across the country. The anomaly is plotted along with 10 years moving average of anomalies obtained from CRU data, which has been discussed in previous section. The time series from both observed datasets have correlation of ~0.8 for the period 1960 – 2000. It can also be seen that decadal averages of both the datasets follow the cycles of warming and cooling in the same years.
However, according to PMD observed data the mean annual temperatures over Pakistan are lesser than that of CRU observed data. PMD observed data shows significant rise in mean temperature from 1998. The mean temperatures have risen at the rate 0.099°C per decade form 1960 to 2007 resulting in total change of 0.47°C, which is significant at 95% level. Warmest year in Pakistan, recorded by PMD is 1988 and second warmest is 2002 in the period aforementioned. There is a drastic rise in temperatures in the last decade. Mean temperature anomaly rose to 0.8°C and then it started dropping down in last five years. The average anomaly from (1961 – 1990) normal in last decade remained 0.4°C.
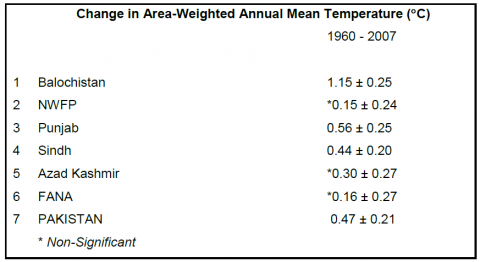
There is a warming trend in mean temperatures of Balochistan, Punjab and Sindh provinces in the period 1960 – 2007, significant at 95% level. The total change in the period is 1.15C, 0.56C and 0.09C, respectively. A non-significant change, though trend is rising, has been observed in Azad Kashmir, FANA and NWFP. The total change was observed to be 0.3C, 0.16C and 0.15C, respectively.